


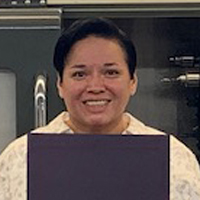
Danielle P., a Symbol Training Institute student, decided to make a career change. Danielle was working in construction and dishwashing at a hotel before enrolling at Symbol Training Institute. Symbol provided training and allowed Danielle to get her “foot in the door” by helping her to land her current role as a Tool and Die Apprentice at Tenneco. “I am beyond grateful!” says Danielle.
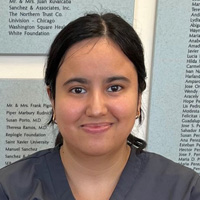
Josephina A. connected with The Partnership’s network, working with Central States SER. She was placed as a Medical Assistant at Alivio Medical Center, a Partnership Healthcare Sector Center employer-partner, where she is now building a career as a healthcare clinician.
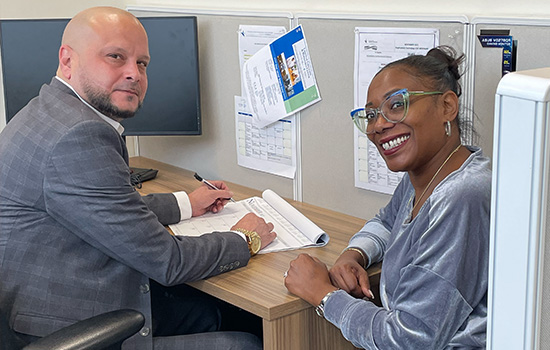
Lama B. was a WIOA client who completed training and obtained advanced IT certifications in cloud and data management, and data analysis. Upon completion, she was referred to the IT Sector Center for job search assistance. The IT Sector Center assisted her with resume updates, interview prep, and setting up a paid work experience that built upon her training and certifications. With assistance from the IT Sector Center, Lama was referred to several employers for open roles and secured a position with a leading healthcare organization as a Data Analyst in July 2022.

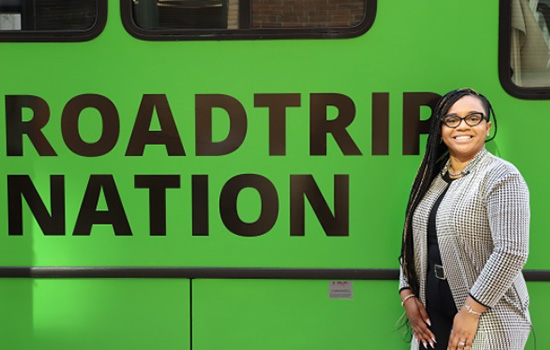
“I never thought this would become a passion, but it really has,” says Alma M. Alma is a former Jane Addams Resource Corporation (JARC) student who benefited from working with The Partnership’s network of services. She enrolled in the Computer Numerical Control (CNC) program at JARC and became a shop lead who manages trainees on the floor. Alma currently works at Lyon & Healy as a machinist.

Danielle P., a Symbol Training Institute student, decided to make a career change. Danielle was working in construction and dishwashing at a hotel before enrolling at Symbol Training Institute. Symbol provided training and allowed Danielle to get her “foot in the door” by helping her to land her current role as a Tool and Die Apprentice at Tenneco. “I am beyond grateful!” says Danielle.
Josephina A. connected with The Partnership’s network, working with Central States SER. She was placed as a Medical Assistant at Alivio Medical Center, a Partnership Healthcare Sector Center employer-partner, where she is now building a career as a healthcare clinician.
Lama B. was a WIOA client who completed training and obtained advanced IT certifications in cloud and data management, and data analysis. Upon completion, she was referred to the IT Sector Center for job search assistance. The IT Sector Center assisted her with resume updates, interview prep, and setting up a paid work experience that built upon her training and certifications. With assistance from the IT Sector Center, Lama was referred to several employers for open roles and secured a position with a leading healthcare organization as a Data Analyst in July 2022.
“I never thought this would become a passion, but it really has,” says Alma M. Alma is a former Jane Addams Resource Corporation (JARC) student who benefited from working with The Partnership’s network of services. She enrolled in the Computer Numerical Control (CNC) program at JARC and became a shop lead who manages trainees on the floor. Alma currently works at Lyon & Healy as a machinist.