Annual Report 2022

The Partnership is the non-profit umbrella organization that operates the largest public workforce system in the country. As the designated administrator of federal workforce development funding for Chicago and Cook County, The Partnership operates a network of more than 90 service locations, made up of American Job Centers, community-based organizations, and sector-driven centers.
The Partnership began in July 2012 with a $3 million cash advance on a $30 million budget. Since then, the non-profit has grown from an organization with a sole focus on workforce development programs funded by the federal Workforce Innovation and Opportunity Act (WIOA) to one that in Program Year 2021 supported a diverse portfolio of more than a dozen non-WIOA funded initiatives.
The Partnership places
to
residents in permanent
employment each year.
Since its inception,
The Partnership has
in federal and philanthropic funds.
Helping Job Seekers Find
a Career They Enjoy


High-Growth, High-Demand
Sector Centers
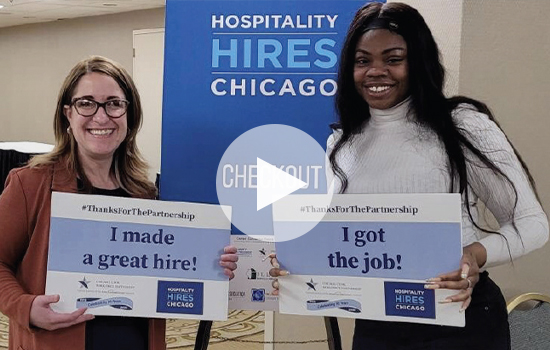
To further support the region’s employers, The Partnership created four industry Sector Centers to meet employer needs through access to federally funded resources. The sectors include Healthcare, Hospitality and Tourism, Information Technology and Transportation, Distribution and Logistics. The Sector Centers deliver recruitment and retention services to employers.
Since 2018, The Partnership has served more than
candidates for apprenticeship programs and private
contractors working on projects in the state combined.
The Partnership’s Hospitality and Tourism Sector Center assisted
Transportation, Distribution and Logistics Sector Center recruited for

positions over the last
program year and provided services to over
new businesses.

Healthcare Sector Center recruited for over
The IT sector center recruited for
The Partnership approved
for Incumbent Worker Training projects. This represents
in Manufacturing, IT, and Healthcare sector companies.

Workforce Innovation and Opportunity Act (WIOA) Investment
Over the past program year, The Partnership invested more than $52 million dollars of WIOA funding into comprehensive workforce development services for more than 9,700 participants. The Partnership met or exceeded performance expectations in serving these customers, by helping them gain new skills and secure long-term employment with good wages.
WIOA Program Year 2021 Adults Served Snapshot
July 2021 – June 2022
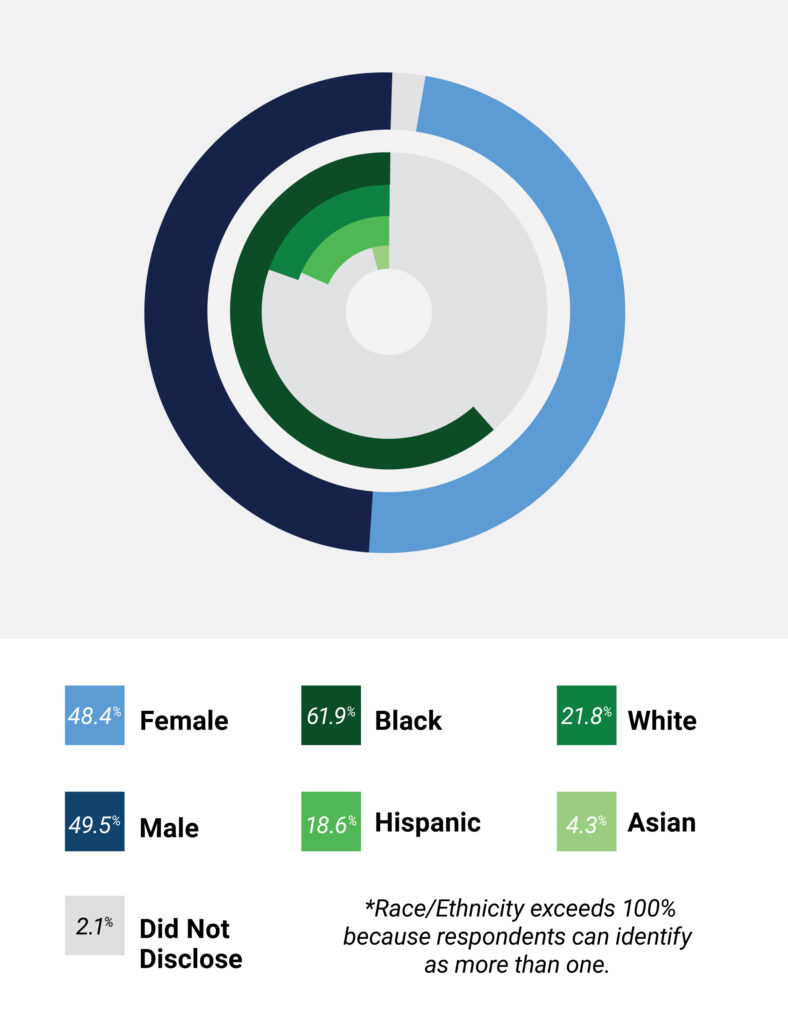
Demographics
- 48.4% – Female
- 49.5% – Male
- 2.1% – Did Not Disclose
- 61.9% – Black
- 21.8% – White
- 18.6% – Hispanic
- 4.3% – Asian
*Race/Ethnicity exceeds 100% because respondents can identify as more than one.
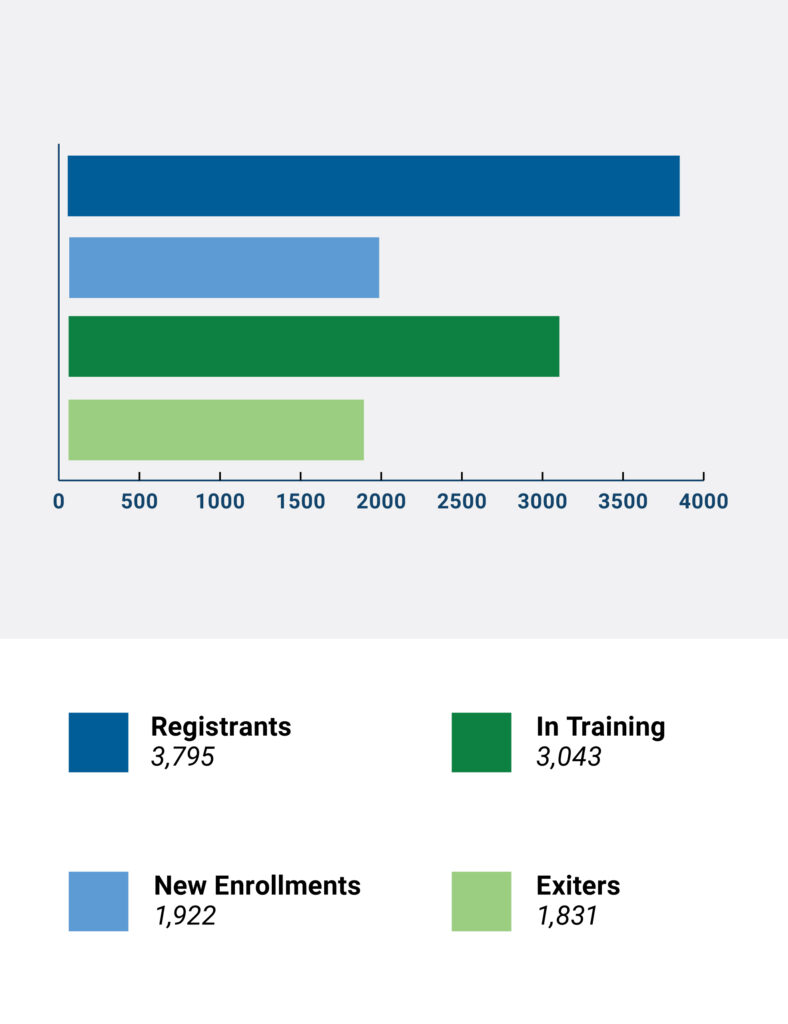
Registrants Served
- 3,795 – Registrants
- 1,922 – New Enrollments
- 3,043 – In Training
- 1,831 – Exiters
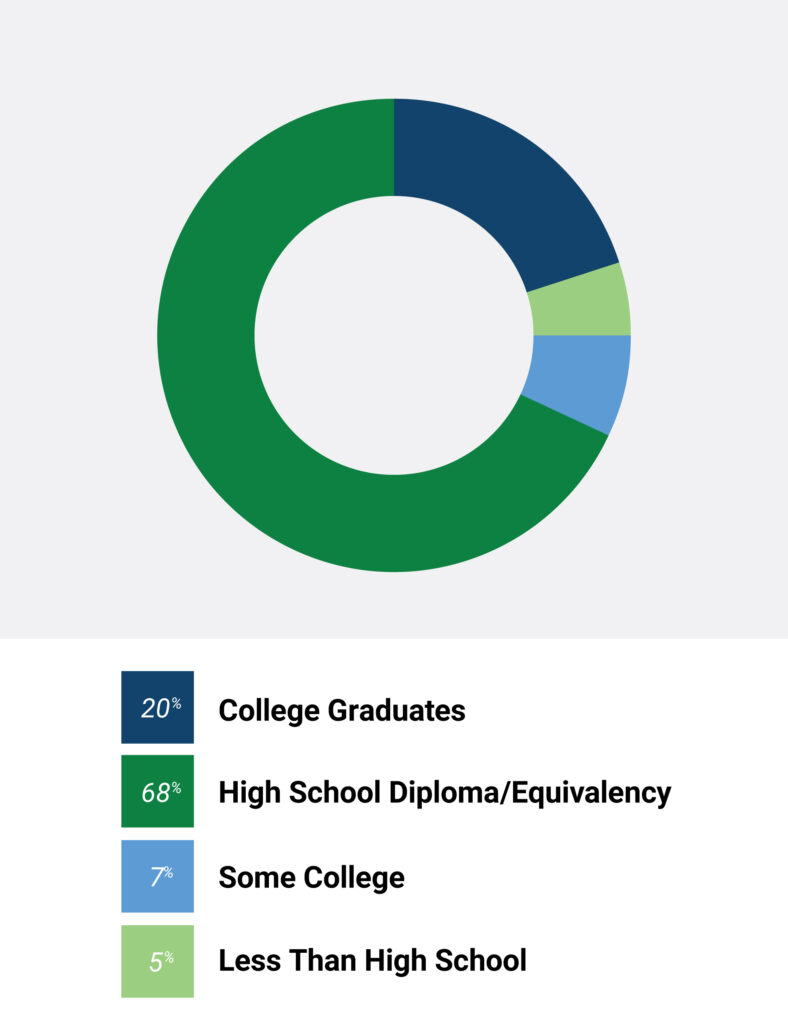
Education
- 20% – College Graduates
- 68% – High School Diploma/ Equivalency
- 7% – Some College
- 5% – Less Than High School
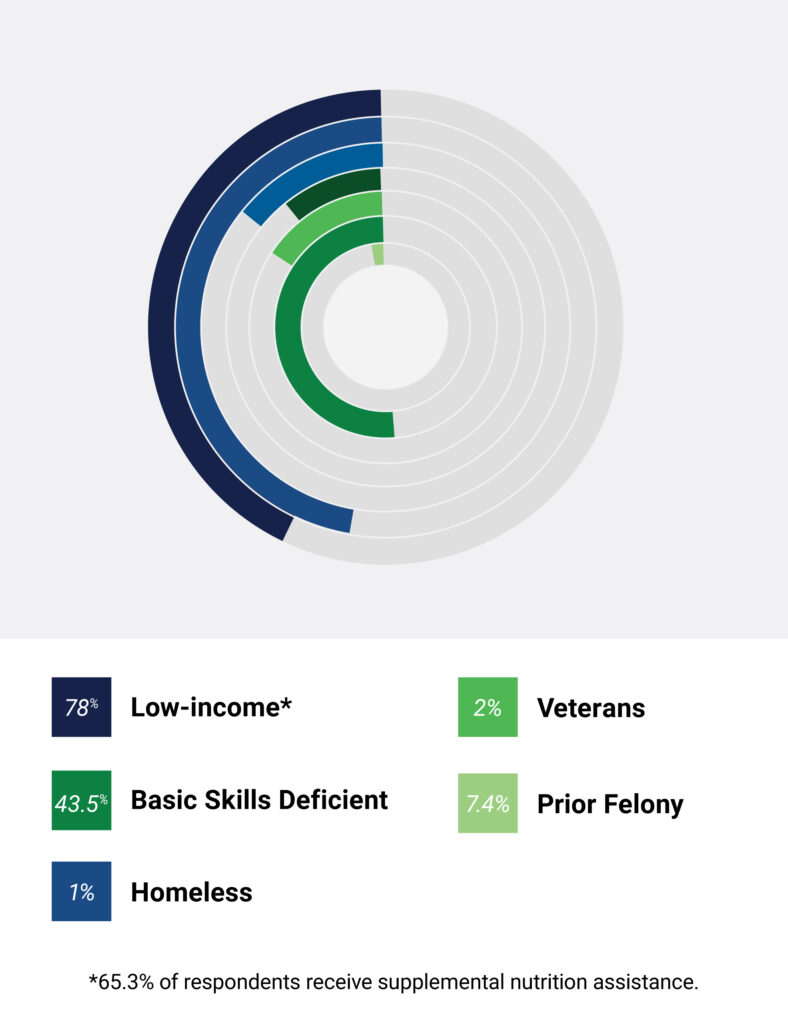
Economic Barriers
- 78% – Low-Income*
- 43.5% – Basic Skill Deficient
- 1% – Homeless
- 2% – Veterans
- 7.4% – Prior Felony
*65.3% of respondents receive supplemental nutrition assistance.
WIOA Program Year 2021 Dislocated Workers Served Snapshot
July 2021 – June 2022
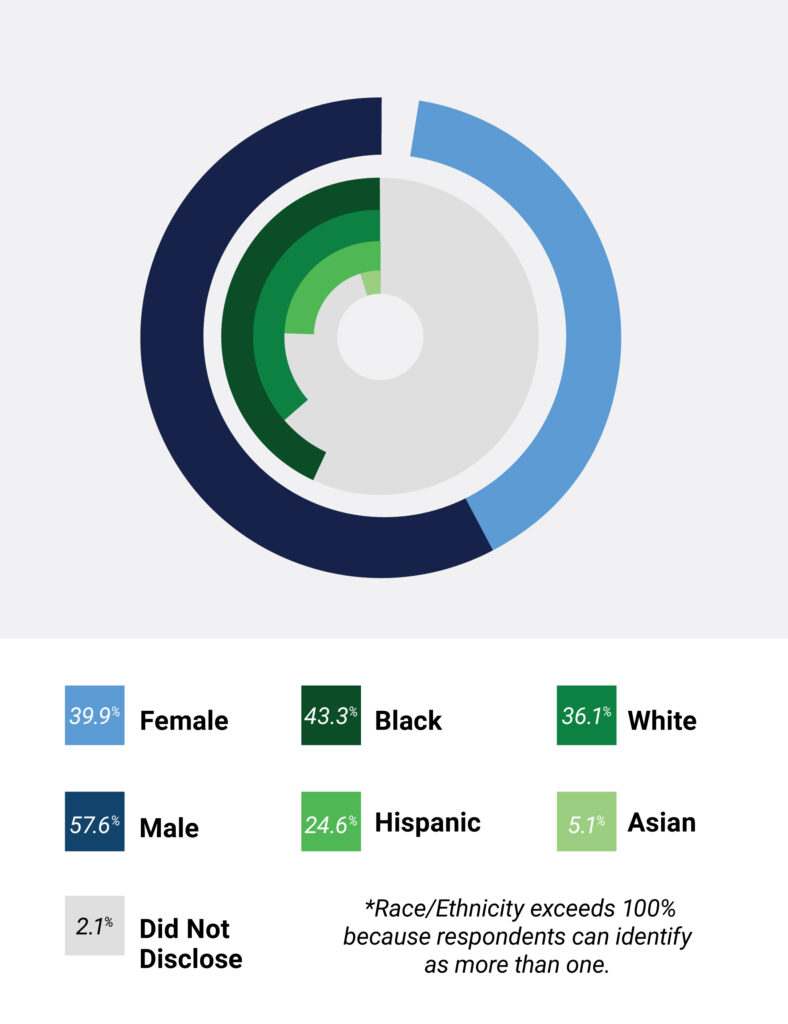
Demographics
- 39.9% – Female
- 57.6% – Male
- 2.1% – Did Not Disclose
- 43.3% – Black
- 36.1% – White
- 24.6% – Hispanic
- 5.1% – Asian
*Race/Ethnicity exceeds 100% because respondents can identify as more than one.
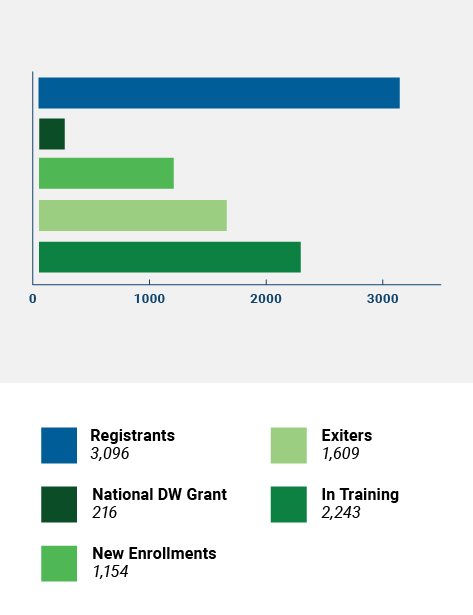
Registrants Served
- 3,096 – Registrants
- 216 – New Enrollments
- 57.5% – In Training
- 23.5% – Exiters
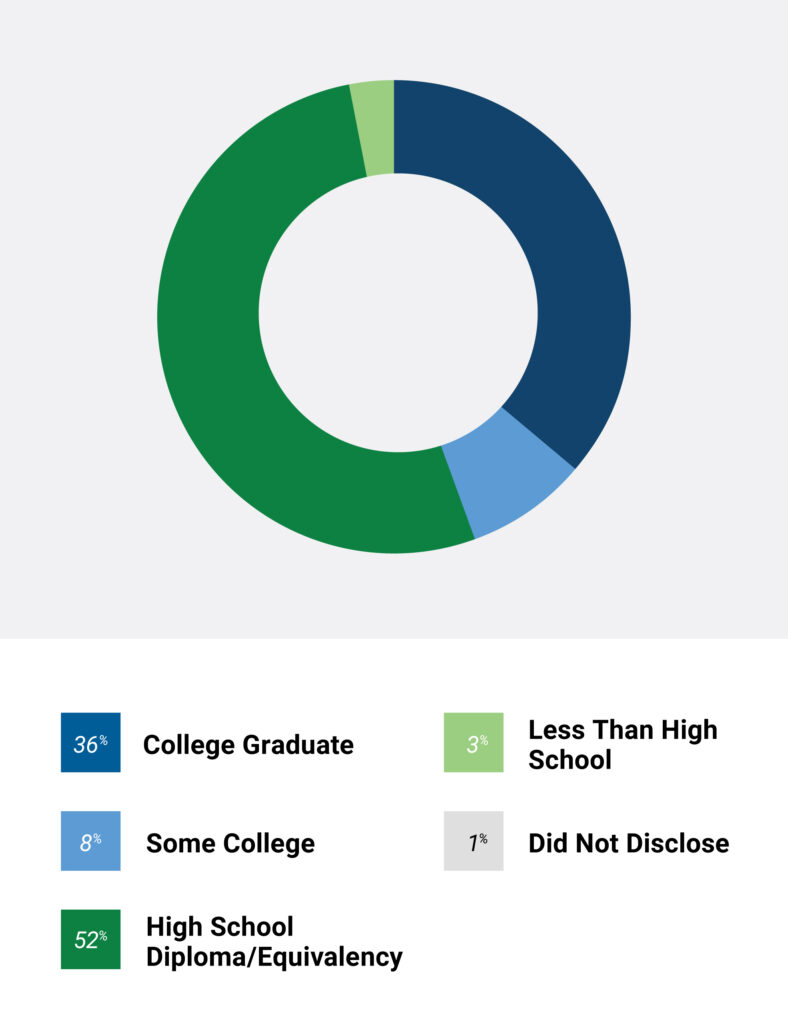
Education
- 36% – College Graduate
- 8% – Some College
- 52% – High School Diploma/Equivalency
- 3% – Less Than High School
- 1% –Did Not Disclose
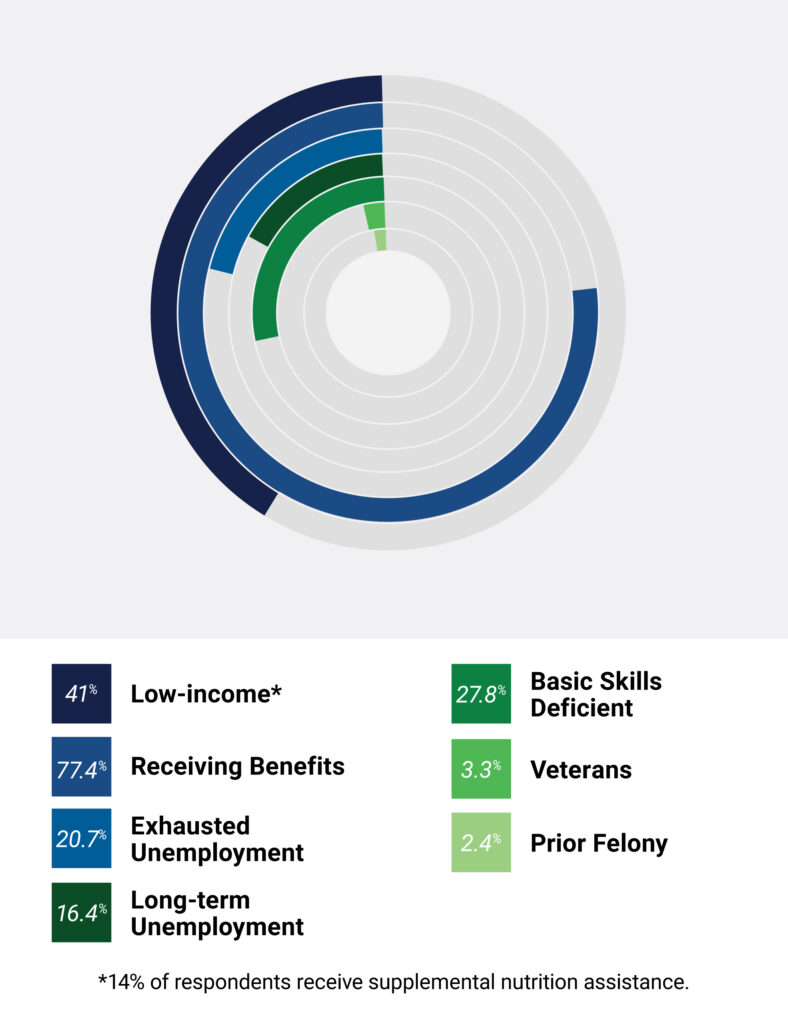
Economic Barriers
- 41% – Low-Income*
- 77.4% – Receiving Benefits
- 20.7% – Exhausted Unemployment
- 16.4% – Long-Term Unemployment
- 27.8% – Basic Skill Deficient
- 3.3% – Veterans
- 2.4% – Prior Felony
*14% of respondents receive supplemental nutrition assistance.
WIOA Program Year 2021 Youth Served Snapshot
July 2021 – June 2022
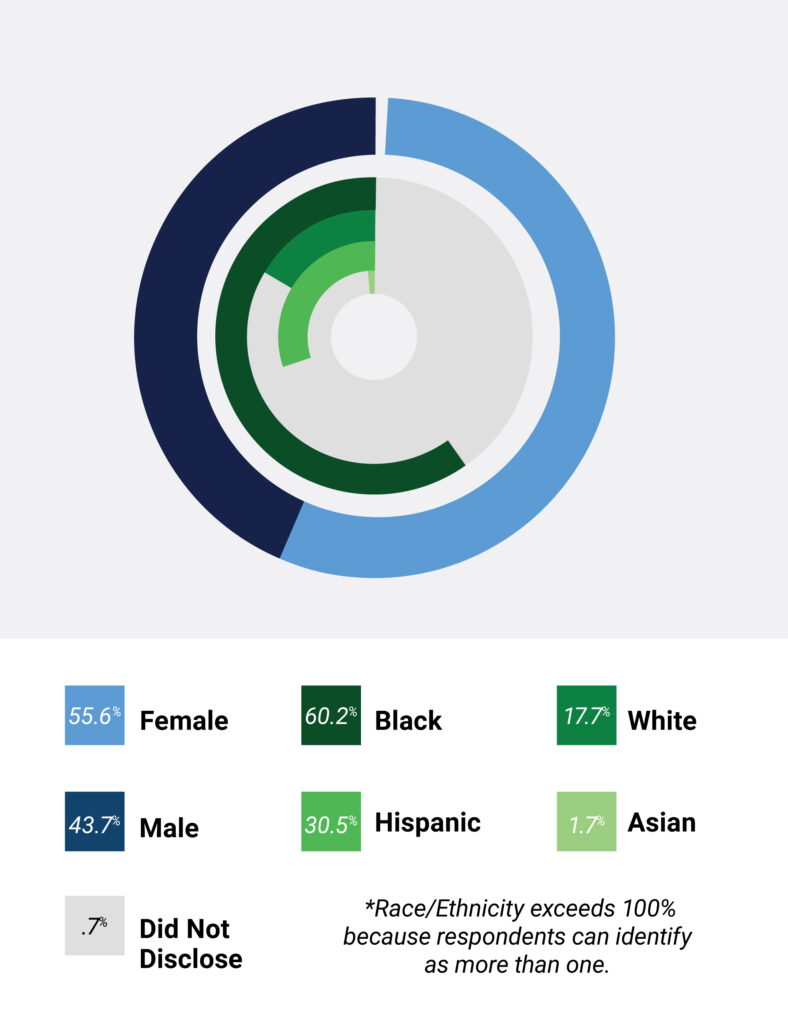
Demographics
- 55.6% – Female
- 43.7% – Male
- .7% – Did Not Disclose
- 60.2% – Black
- 17.7% – White
- 30.5% – Hispanic
- 1.7% – Asian
*Race/Ethnicity exceeds 100% because respondents can identify as more than one.
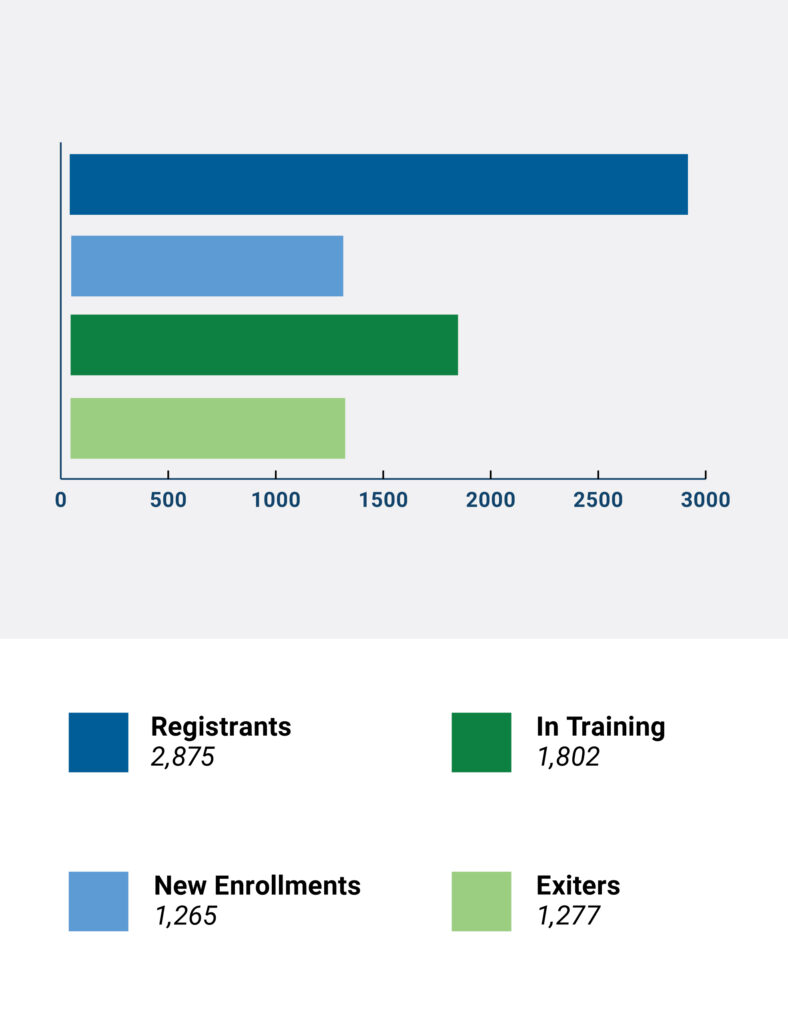
Registrants Served
- 2,875– Registrants
- 1,265 – New Enrollments
- 1,802 – In Training
- 1,277 – Exiters
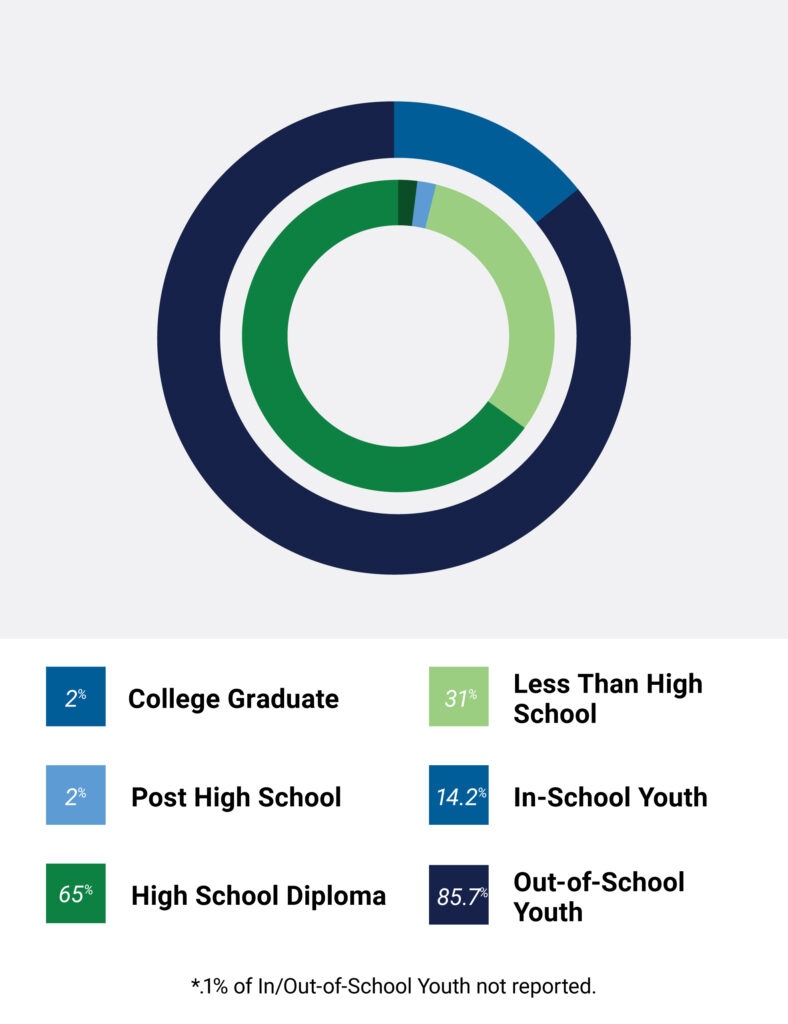
Education
- 2% – College Graduate
- 8% – Some College
- 52% – High School Diploma/Equivalency
- 3% – Less Than High School
- 1% –Did Not Disclose
*.1% of respondents receive supplemental nutrition assistance.
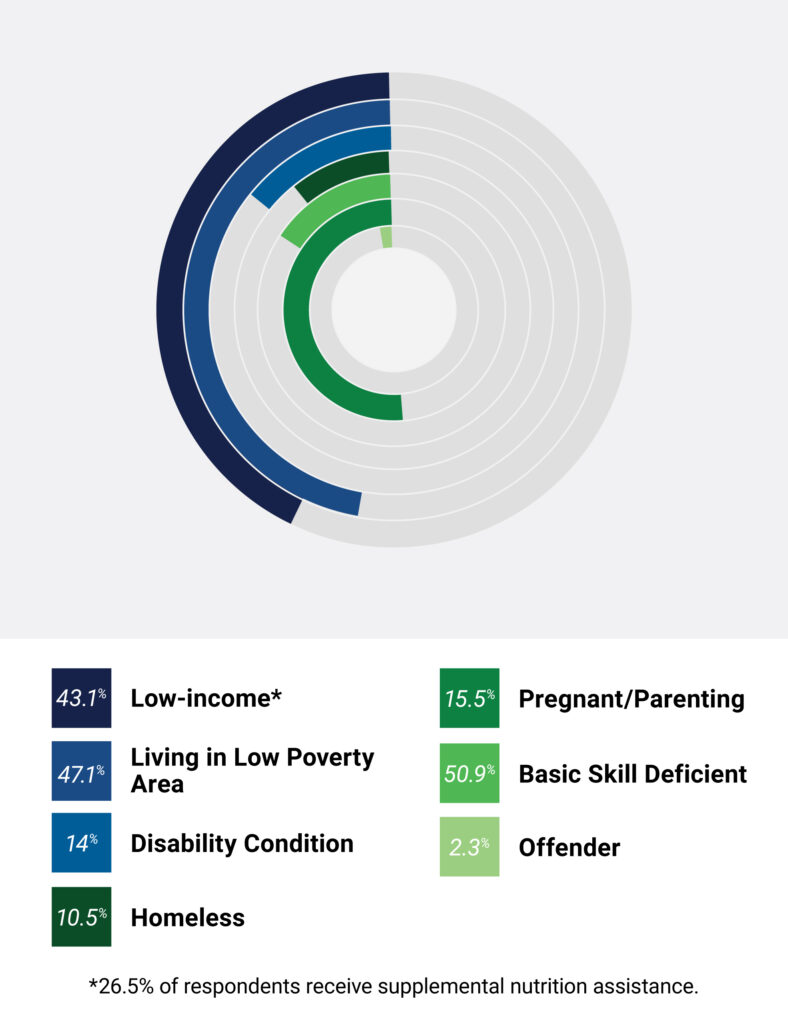
Economic Barriers
- 43.1% – Low-Income*
- 47.1% – Living in Low Poverty Area
- 14% – Disable Conditions
- 10.5% – Homeless
- 15.5% – Pregnant/Parenting
- 3.3% – Basic Skill Deficient
- 2.4% – Offender
*26.5% of respondents receive supplemental nutrition assistance.
2022 Financial Information
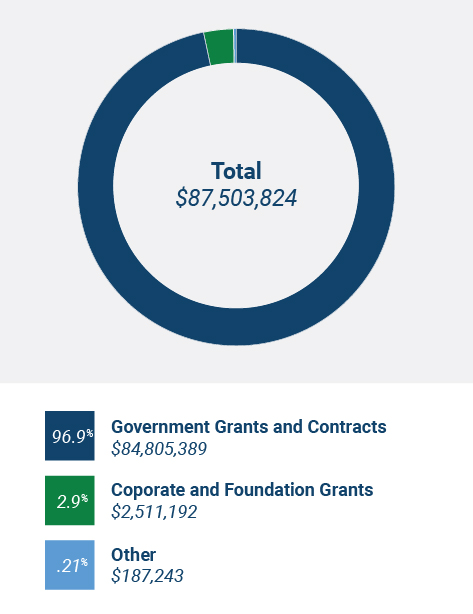
Revenue
- 96.9% – Government Grants and Contracts
$84,805,389 - 2.9% – Corporate and Foundation Grants
$2,511,192 - .21% – Government Grants and Contracts
$187,243
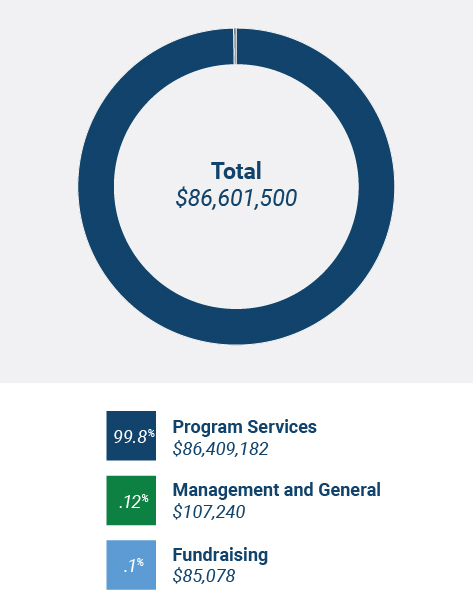
Expenses
- 99.8% – Program Services
$86,409,182 - .12% – Management and General
$107,240 - .1% – Fundraising
$85,078
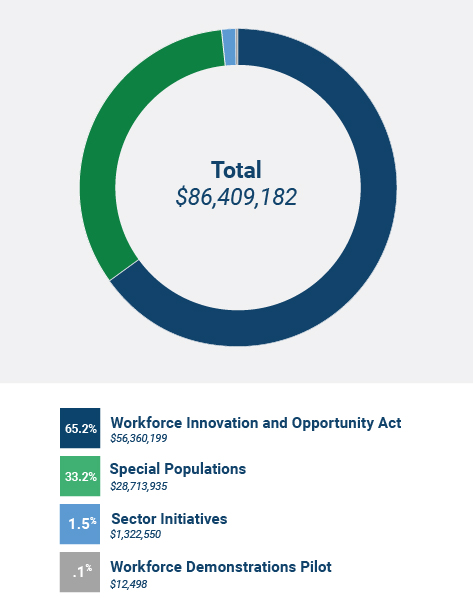
Program by Expense Area
- 65.2% – Workforce Innovation and Opportunity Act
$56,360,199 - 33.2% – Special Populations
$28,713,935 - 1.5% – Sector Initiatives
$1,322,550 - .1% – Workforce Demonstrations Pilot
$12,498
