WIOA Funding Outcomes
$35 M+ Earned in 2nd Quarter Wages After Exiting WIOA Funded Network (PY23)
$15.1 M+
Adult Workers
$13.4 M+
Dislocated Workers
$6.9 M+
Youth Workers
Adults Served by WIOA Funding
July 1, 2023 - June 30, 2024
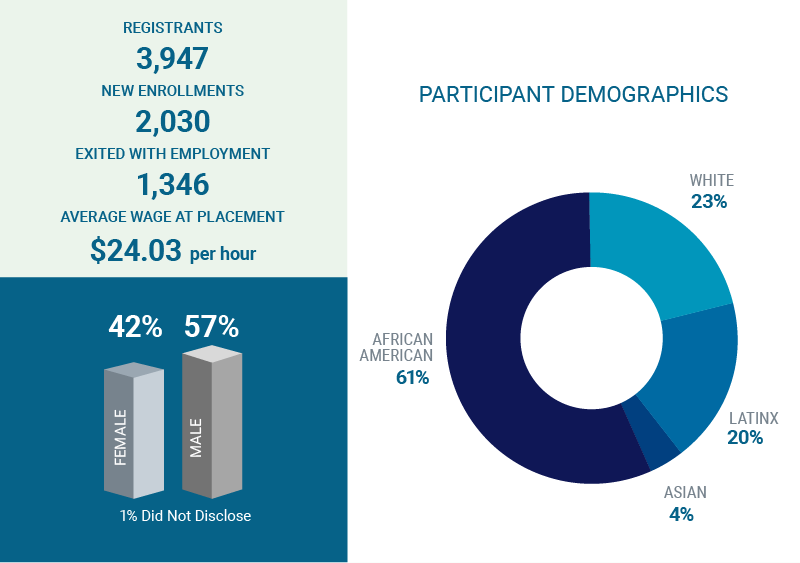
Program Statistics
- Registrants: 3,947
- New Enrollments: 2,030
- Exited With Employment: 1,346
- Average Wage at Placement: $24.03 per hour
Participant Demographics
- 61% – African-American
- 23% – White
- 20% – Latinx
- 4% – Asian
Gender
- Female: 42%
- Male:57%
- Did not disclose: 1%
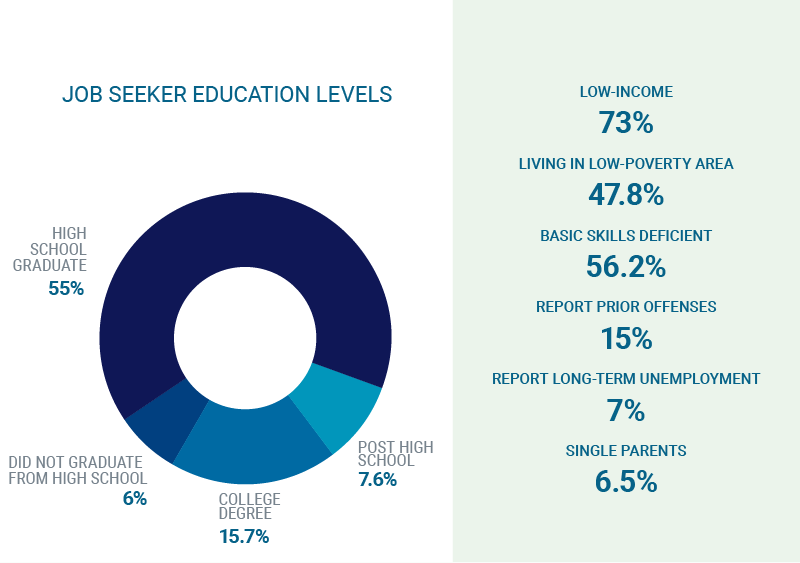
Job Seeker Education Levels
- 55% – High School Graduate
- 15.7% – College Degree
- 7.6% – Post High School
- 6% – Did not graduate from High School
Demographics:
- Low-Income: 73%
- Living in Low-poverty area: 47.8%
- Basic Skills Deficient: 56.2%
- Report Prior Offenses: 15%
- Report Long-term Unemployment: 7%
- Single Parents: 6.5%
Dislocated Workers Served by WIOA Funding
July 1, 2023 - June 30, 2024
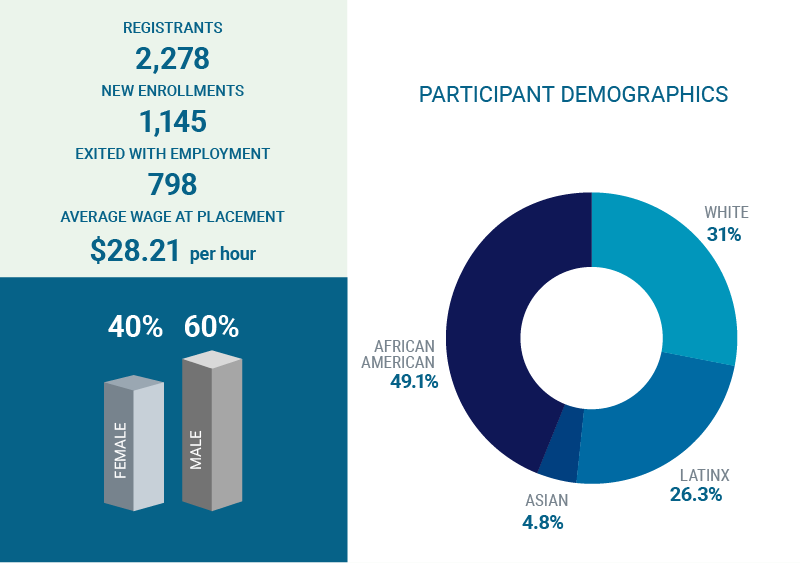
Program Statistics
- Registrants: 2,278
- New Enrollments: 1,145
- Exited With Employment: 798
- Average Wage at Placement: $28.21 per hour
Participant Demographics
- 49.1% – African-American
- 31% – White
- 26.3% – Latinx
- 4.8% – Asian
Gender
- Female: 40%
- Male:60%
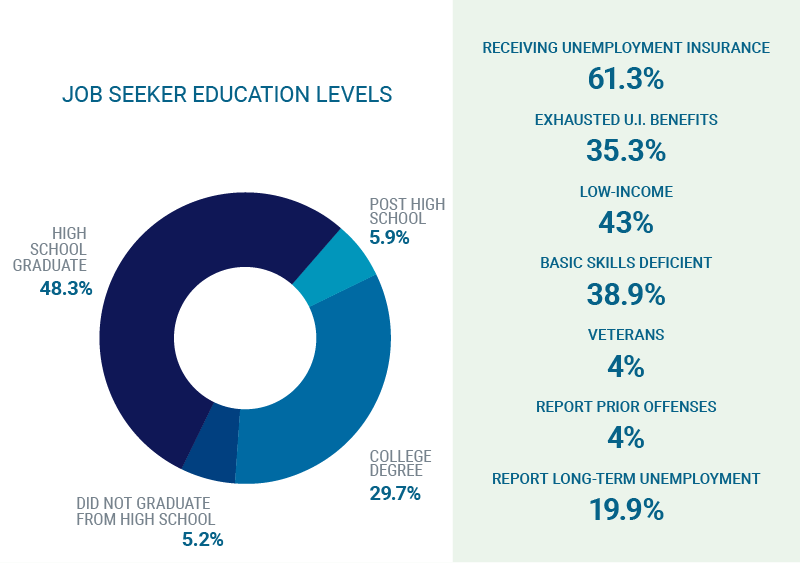
Job Seeker Education Levels
- 48.3% – High School Graduate
- 29.7% – College Degree
- 5.9% – Post High School
- 5.2% – Did not graduate from High School
Demographics:
- Receiving Unemployment Insurance: 61.3%
- Exhuasted U.I. Benefits: 35.3%
- Low-Income: 43%
- Basic Skills Deficient: 38.9%
- Veterans: 4%
- Report Prior Offenses: 4%
- Report Long-Term Unemployment: 19.9%
Youth Served by WIOA Funding
July 1, 2023 - June 30, 2024
Program Statistics
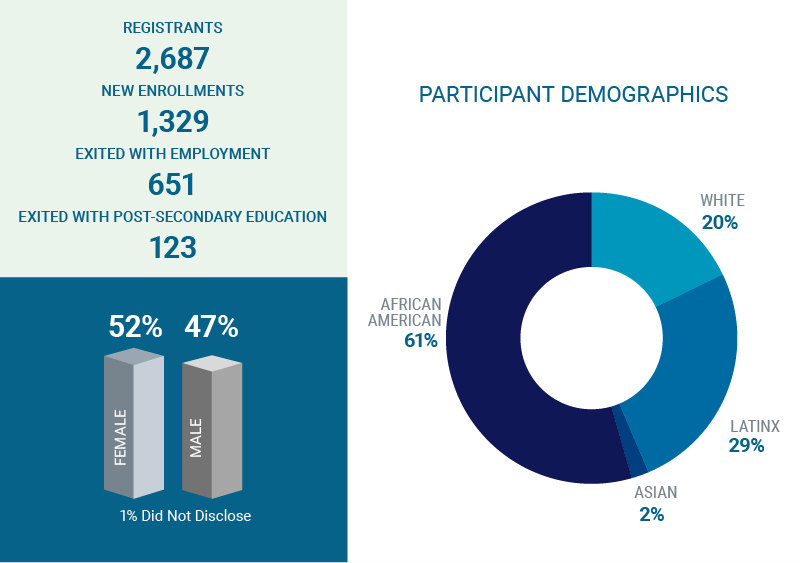
- Registrants: 2,687
- New Enrollments: 1,329
- Exited With Employment: 651
- Exited With Post-secondary Education: 123
Participant Demographics
- 61% – African-American
- 20% – White
- 29% – Latinx
- 2% – Asian
Gender
- Female: 52%
- Male:47%
- Did not disclose: 1%
Job Seeker Education Levels
- 55% – High School Graduate
- 15.7% – College Degree
- 7.6% – Post High School
- 6% – Did not graduate from High School
Demographics:
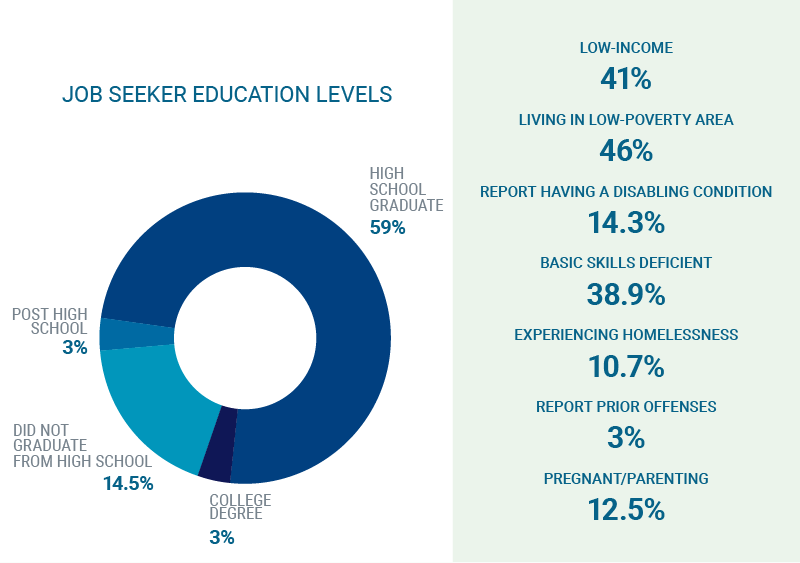
- Low-Income: 41%
- Living in Low-poverty area: 46%
- Report Having a Disabling Condition: 14.3%
- Basic Skills Deficient: 38.9%
- Experiencing Homelessness: 10.7%
- Report Prior Offenses: 3%
- Pregnant/Parenting: 12.5%
WIOA Participant Outcomes
67%
Received Training Services
70%
Employed at Program Completion
$25.59
Median Hourly Earnings at Exit
